
The True Cost of New Construction in Omaha — What the Builder's Price Tag Doesn't Include
The base price a builder quotes you is real but it's not the full story. In Omaha's new construction market, buyers routinely discover that SID taxes, HOA fees, lot premiums, landscaping, window coverings, and the eventual replacement of builder-grade systems can add tens of thousands of dollars to the actual cost of ownership over the first decade. This guide breaks down every expense category that doesn't show up in the contract price with real numbers from Omaha's most active new construction communities, so you can make a genuinely informed comparison between new builds and resale homes.
Buying new construction in Omaha's suburban communities involves costs that extend well beyond the purchase price. Move-up buyers trading a $300,000 home for a $450,000 property often discover their monthly ownership costs increase by far more than expected sometimes $2,000 to $3,000 per month beyond the mortgage difference alone. This guide documents the specific costs that catch buyers off guard and provides realistic projections for what ownership actually costs over the first five years.
Total ownership costs play a major role in financing strategy. For homeowners considering buying before selling their current home, higher carrying costs from new construction can materially affect affordability and risk.
Table of Contents
- Why Move-Up Buyers Underestimate New Construction Costs
- Property Tax Reality in Douglas and Sarpy Counties
- Understanding SID Assessments and Special Taxes
- HOA Fee Escalation Patterns
- Homeowners Insurance Costs in Omaha
- Utilities and Maintenance Reserves
- 5-Year Cost Escalation Model
- Worst-Case Scenario Planning
Why Move-Up Buyers Underestimate New Construction Costs
Property tax shock is the single largest surprise for new construction buyers in Omaha. Residential assessed values in the Omaha metro have doubled over the past decade, with 2024-2025 alone seeing 13.8% assessed value increases on individual homes. This translates to 15.2% annual tax bill increases despite Nebraska's property tax caps. Most agents quote initial tax estimates but do not explain how rapidly these numbers compound.
Closing disclosure documents in new subdivisions often obscure ongoing assessments. Sanitary Improvement District bond information, special assessment schedules, and future tax implications are typically buried in 80+ page closing documents. The vast majority of move-up buyers cannot decode SID principal and interest breakdowns at purchase, leading to unexpected annual bills of $1,000 to $3,000 for twenty years.
HOA fees present another area of underestimation. Initial advertised fees of $85 to $150 per month seem manageable, but annual increases of 3% to 5% compound to 34% cumulative growth over a decade. HOA boards budget conservatively in Year 1, then accelerate rates after residents move in. New construction homes are often sized at 2,500 to 3,000 square feet—larger than most move-up buyers' previous homes—which increases utility consumption. OPPD and MUD bills average $300 to $350 monthly but climb 5% to 8% annually.
Property Tax Reality in Douglas and Sarpy Counties
Douglas County applies a 2.3094% effective tax rate to assessed value, while Sarpy County's rate is 2.2809%. On a $450,000 home assessed at 93% of market value, this produces an annual tax bill of approximately $10,389 in Douglas County. The 0.03% difference between counties amounts to roughly $135 annually—not material to the purchase decision.
Recent escalation patterns reveal consistent upward pressure. Douglas County saw 6.89% average assessed value growth in 2023-2024, followed by 5.25% countywide growth in 2024-2025. Individual homes experienced increases of 13.8% in a single year. Omaha Public Schools increased their levy rate by 7% in 2025 alone, capturing revenue beyond assessment growth. Projections suggest an additional 7% growth in 2025-2026, with Omaha classified as a hot market resistant to regional fluctuations.
How Property Tax Bills Break Down
Using a $450,000 home that increased to $512,000 in assessed value as an example, the annual tax bill components changed as follows:
| Taxing Entity | Previous Year | Current Year | Increase |
|---|---|---|---|
| Douglas County | $1,305 | $1,485 | +$180 (13.8%) |
| City of Omaha | $1,976 | $2,248 | +$272 (13.8%) |
| OPS School District | $4,982 | $5,786 | +$804 (16.1%) |
| Total Annual Tax | $8,263 | $9,519 | +$1,256 (15.2%) |
Nebraska's Truth-in-Taxation law requires "pink postcard" notifications of proposed increases, but most homeowners treat these as informational only and do not attend public hearings to dispute assessments.
Understanding SID Assessments and Special Taxes
A Sanitary Improvement District is a special taxing district created by developers to finance infrastructure in new subdivisions located outside city limits. Roads, sewer systems, water lines, sidewalks, and street lights are funded through municipal bonds that homeowners repay via special assessments and ongoing annual SID taxes. These costs typically add $1,000 to $3,000 annually for twenty years—on top of regular property taxes.
SID assessments are fundamentally different from property taxes in one critical way: they are non-deductible on federal tax returns. Special assessments that benefit only a portion of the community cannot be claimed on Form 1040. A typical $25,000 to $50,000 SID assessment financed over the life of the bond represents $45,000 to $110,000 in total cost over twenty years—none of which reduces federal tax liability.
How SIDs Work
Developers form SIDs to build infrastructure without direct city expense, enabling rapid buildout in fringe areas. Municipal bonds with 20-year maturities fund upfront construction costs, while construction warrants cover work-in-process payments. Bonds are repaid through special assessments levied against specific parcels and ad valorem property taxes collected within the SID.
A 5-member Board of Trustees governs each SID, initially appointed by the developer and later elected by property owners. The board sets tax rates, approves budgets, and manages operations including employee salaries, insurance, materials, repairs, audits, elections, and bond servicing. When the area is eventually annexed by the city, the SID ceases to exist, but property taxes typically do not decline as the city takes over services.
Finding SID Information Before Purchase
Ask the listing agent explicitly whether the property is in a SID and request the SID number. Check the Douglas County Assessor SID Map online. Review the Closing Disclosure for line items labeled "Special Assessment District" or "SID Tax." Request SID Board minutes and five-year budget projections from the title company to understand expected annual costs. Verify the SID bond maturity date to know when the special tax obligation ends.
Red flags include SIDs formed within the past two years (bonds likely front-loaded with highest interest rates), SID budgets showing escalating operating costs (indicating reserve shortfall planning), bonds not yet issued (developer financing not secured), and SID Board minutes showing disputes between developer and homeowners.
HOA Fee Escalation Patterns
HOA fees in Omaha's new construction neighborhoods typically range from $85 to $150 per month at initial purchase, covering covenant enforcement, landscaping, common area maintenance, amenities, insurance for common areas, and management services. The 67% of new builds that include mandatory HOAs contrast with the 44.6% overall prevalence in existing listings.
Normal annual fee increases run 3% to 5%, but the compounding effect over time is substantial. A $1,560 annual fee growing at 3.5% becomes $1,793 by Year 5 and $2,101 by Year 10. At 5% annual growth, that same fee reaches $1,991 by Year 5 and $2,541 by Year 10. Most HOA boards can approve increases of 10% to 20% without homeowner vote, with larger increases requiring member approval.
Hidden HOA Cost Drivers
Insurance premiums for common areas increase 5% to 8% annually in normal years, but post-disaster spikes of 20% to 40% in a single year are common in Nebraska's severe weather environment. Labor costs for landscaping and maintenance rise with general inflation. Reserve fund requirements for future capital projects create pressure to increase fees or face deferred maintenance.
Beyond regular dues, HOA boards can impose one-time special assessments for emergency repairs or major capital projects without adequate reserve funds. A $15,000 common area roof replacement spread across 50 homeowners adds $300 per household. Larger projects can add thousands in unexpected costs.
Request three-year budget history from the HOA before purchasing. If fees have not increased in three or more years, deferred maintenance is likely and a capital reserve study should be requested. Proposed increases exceeding 10% in a single year without emergency justification, consecutive increases above 7% annually, and reserve funds below 50% of the 12-month budget all warrant careful evaluation.
Homeowners Insurance Costs in Omaha
Nebraska homeowners pay 114% above the national average for home insurance. The statewide average premium is $4,505 per year compared to the national average of $2,110. Omaha specifically averages $4,640 annually. Severe weather exposure—hail, tornadoes, and convective storms—creates high claims frequency and severity that insurers price into premiums.
New construction in suburban areas exposed to hail risk faces higher premiums than established neighborhoods. While initial premiums may be slightly lower due to lack of claims history, rates increase faster as insurers track regional weather patterns. Year-over-year increases of 7% to 8% are typical, with post-storm spikes sometimes reaching 20% to 40% in a single year.
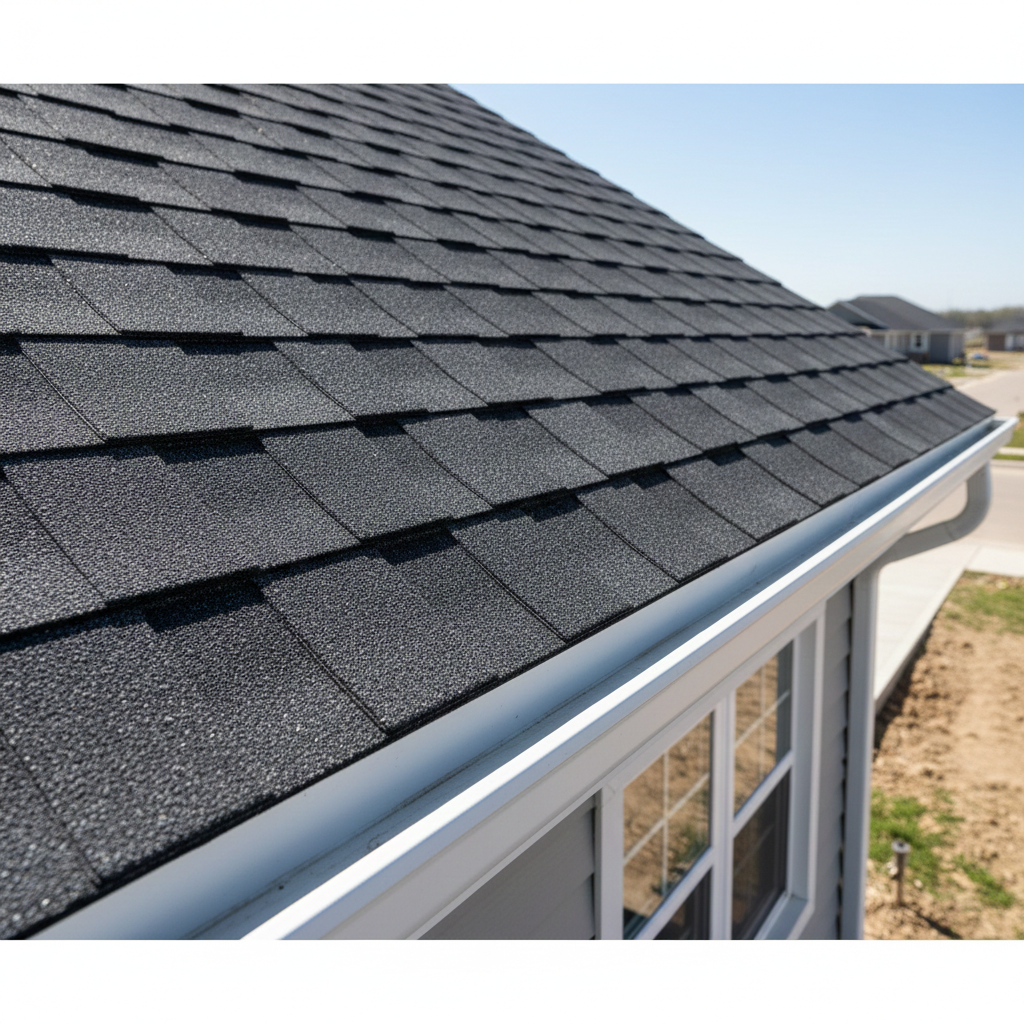
Mitigation strategies include bundling auto and home policies for 5% to 15% discounts, requesting replacement cost endorsements rather than actual cash value coverage, and storm hardening measures. Impact-resistant roofing, reinforced garage doors, and hail-guard siding can reduce premiums by 10% to 20%. Maintaining a claim-free history builds discount eligibility over time.
Utilities and Maintenance Reserves
OPPD electricity rates include a $30 monthly service charge plus 10.95 cents per kilowatt-hour in summer months and 8.92 cents in non-summer months, with a fuel and purchased power adjustment adding approximately 0.46 cents per kilowatt-hour. MUD ranks fourth lowest nationally for gas rates, with water rates in the mid-range. Combined utility bills for typical move-up homes run $300 to $350 monthly, with larger homes reaching $175 each for MUD and OPPD.
New construction homes sized at 2,500 to 3,000 square feet consume 25% to 50% more energy than a 2,000 square foot previous home. The first two to three years of ownership involve a learning curve as homeowners discover actual consumption patterns despite builder claims of energy efficiency.
Maintenance Reserve Requirements
The standard guideline of budgeting 1% of home value annually for maintenance translates to $4,500 per year for a $450,000 home. Move-up buyers typically budget $200 to $250 monthly and face a $2,000+ annual shortfall by Years 3 through 5 when systems begin requiring attention.
| Year | Expected Expenses | Estimated Cost |
|---|---|---|
| Year 1-2 | Minor warranty issues, HVAC tune-up, small plumbing leaks | $500-$1,500 |
| Year 3-4 | Water heater replacement, A/C service, roof inspection | $2,000-$4,500 |
| Year 5-7 | HVAC replacement, electrical panel upgrade, foundation repair | $4,000-$8,000 |
| Year 8-10 | Roof repair or partial replacement | $5,000-$12,000 |
The assumption that new construction means no repairs proves false in practice. New homes reveal defects in Years 2 through 4 as foundations settle, HVAC systems require calibration, and plumbing develops leaks from pressure changes.
5-Year Cost Escalation Model
Using a $450,000 new construction home with $100,000 down and a $350,000 mortgage at 6.5%, Year 1 monthly ownership costs total approximately $4,387. This includes $2,210 for mortgage principal and interest, $865 for property taxes, $387 for insurance, $130 for HOA fees, $320 for utilities, $375 for maintenance reserves, and $100 for internet service.
By Year 2, property taxes increase 7% to $11,116 annually, HOA fees rise 3.5% to $1,613, utilities climb 5% to $4,032, and insurance increases 8% to $5,011. The total monthly increase ranges from $160 to $200 beyond Year 1 costs.
Year 3 brings compounding effects. Property taxes reach $11,838 with another 6.5% increase. HOA fees hit $1,677. Insurance climbs to $5,362. If a school bond election passes, property taxes could spike an additional 7% to 15%. Major maintenance needs—HVAC service plan initiation, water heater inspection, potential foundation crack repair—typically run $3,000 to $6,000.
Cumulative 5-Year Cost Growth
| Category | Year 1 Annual | Year 5 Annual | 5-Year Increase |
|---|---|---|---|
| Property Taxes | $10,389 | $13,200 | +$2,811 (27%) |
| HOA Fees | $1,560 | $1,793 | +$233 (15%) |
| Insurance | $4,640 | $6,088 | +$1,448 (31%) |
| Utilities | $3,840 | $4,672 | +$832 (22%) |
| Total Non-Mortgage | $24,929 | $30,253 | +$5,324 (21%) |
This projection excludes SID ongoing assessments, which add $1,000 to $3,000 annually depending on the district. The move-up buyer trading a $300,000 home with $18,000 to $22,000 in annual ownership costs for a $450,000 home expecting approximately $30,000 in annual costs actually faces Year 5 costs of $55,000 to $60,000—67% to 100% higher than initial projections.
Worst-Case Scenario Planning
A combination of adverse events in a concentrated two to three year period can create $15,000 to $20,000 in unexpected expenses. This scenario includes: a school bond passing in Year 3 adding $1,300 to the annual tax bill, a severe hail storm in Year 4 triggering a 20% insurance premium increase worth $928 annually, an HVAC compressor failure requiring $3,800 in replacement costs, the SID Board increasing annual tax rates due to reserve shortfalls by $500 per year, and an HOA special assessment of $2,000 for common area roof leak repairs.
The cumulative impact includes $2,000 to $2,500 in permanent recurring cost increases plus $6,000 to $8,000 in one-time capital events. Move-up buyers should maintain a separate maintenance reserve fund of $10,000 to $15,000 beyond the 1% annual budget specifically for Years 3 through 5. Attending HOA meetings helps avoid special assessment disputes, and refinancing if interest rates drop can lock in equity during periods of increased costs.
If you are evaluating new construction in Elkhorn, Bennington, Gretna, or other Omaha suburbs, understanding the full ownership cost picture before making an offer prevents the financial stress that catches many move-up buyers off guard. I help my clients model these projections specific to their target neighborhoods so they can make confident purchasing decisions.
About Linda Moy
Move-Up & Sell-to-Buy Real Estate Specialist | Nebraska Realty
Linda Moy specializes in helping homeowners sell their current home and move up with clarity, confidence, and control. Her approach focuses on timing strategy, equity optimization, and protecting clients from common sell-to-buy risks like double payments, missed opportunities, or rushed decisions.
A consistent top producer, Linda is known for her calm leadership, detailed planning, and ability to align selling and buying timelines smoothly. Her work has earned multiple honors, including Rookie of the Year, Entrepreneur of the Year (Women's Council of Realtors®), and the Nebraska Realty Renne Lampman Award for outstanding service.
Originally from McCook, Nebraska, Linda has called Omaha home since 1993 and remains deeply involved in the community, including board service with the Divine Mercy Food Pantry.
Thinking about moving up?
Let's map your move together
Categories
Recent Posts


SCHEDULE YOUR MOVE-UP STRATEGY SESSION
Move WITHOUT the stress, double moves, or leaving equity on the table.
Connie Karnes
Brenna Allen
Kayla Mack
Vicki Smith
Tyler Steel
Dawson Spurgis
Allyson Spurgis
SARAH VIDEGLA
Larry Whitmore